Updates

Personal exposure exceeding guideline values

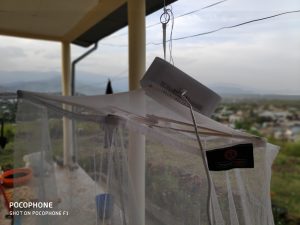
For the 10 participants of a pilot study, personal exposures to Carbon Monoxide (CO) and PM2.5 concentrations exceed guideline values. You can read more about these measurements on the project page.

Guideline values

The World Health Organization (WHO) advises a PM2.5 guideline of 25 μg/m3 as 24-hour average (source), while Ethiopia uses a guideline value of 65 μg/m3 as 24-hour average (Guideline Ambient Environment Standards for Ethiopia, 2003).

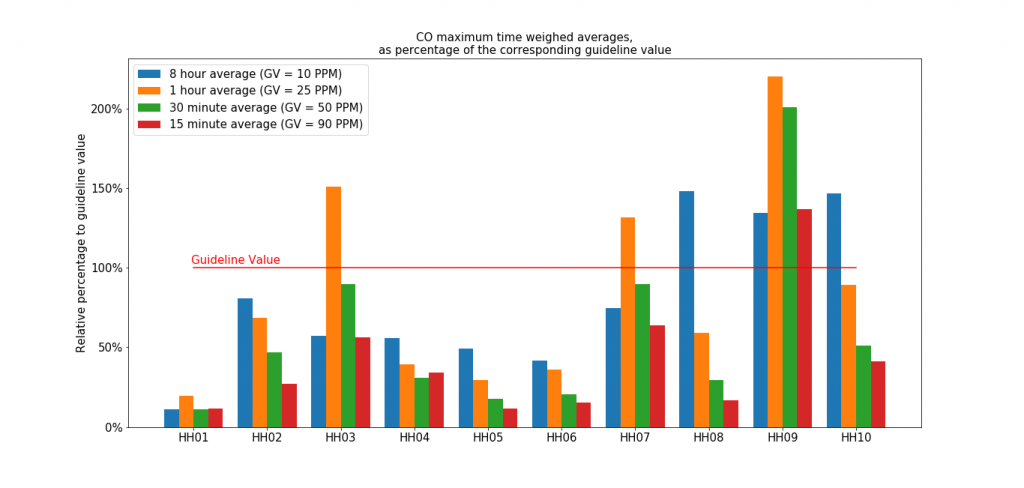
For CO, guideline values are given at shorter time average periods, as health effects from CO can be more direct. Both the WHO and Ethiopia use guideline values at averaging periods of 15 minutes, 30 minutes, 1 hour and 8 hours of respectively 90, 50, 25 and 10 PPM.

Measured CO exposure

During the 24-hour measurements, peaks up to 400 PPM were measured. The figures show the measured CO concentration as boxplots for each of the participants, without and with values outside the whiskers.

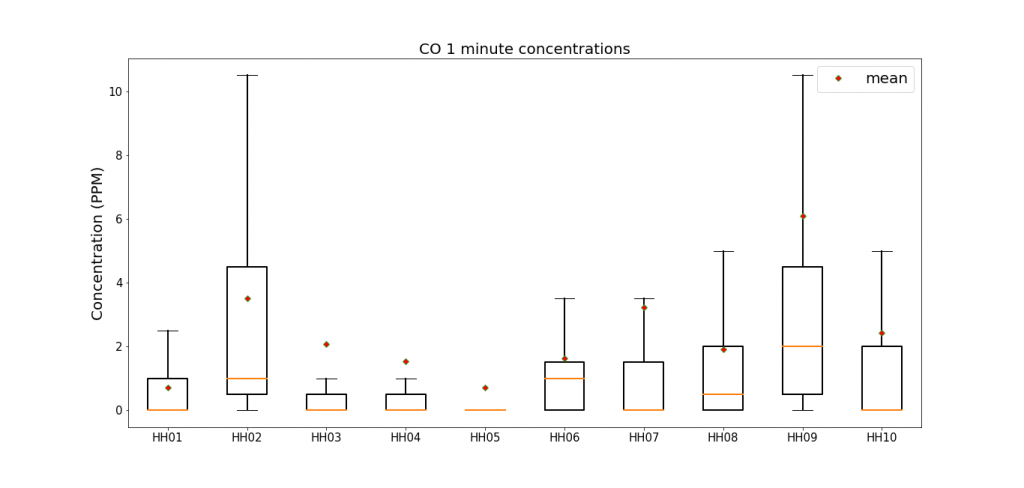
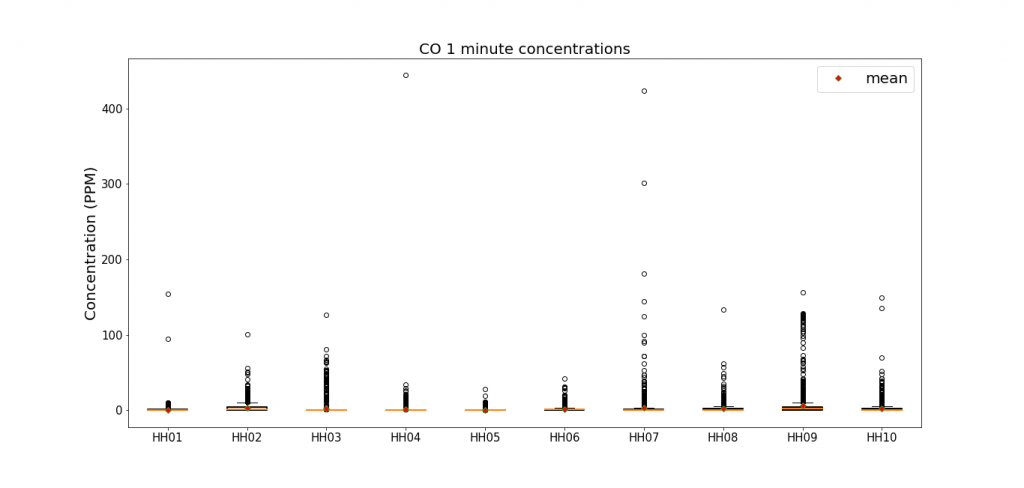
24-hour average concentrations are below 6 PPM, and for all participants 75% of all data is lower than 5 PPM. There are however peak concentrations of sometimes up to 400 PPM.

To compare the measured concentrations to guideline values, we have to use 15 minute, 30 minute, 1 hour and 8 hour average concentrations. Each of these time averaging period have their own guideline value. To compare them in one graph, the below graph shows the highest average value of each of these time periods, relative to the guideline value for that averaging period. Averaging concentrations higher than 100% imply that the concentration exceeds the guideline value.

CO maximum average concentrations, relative to the respective guideline values.
Measured PM2.5 exposure

Comparing the measured PM2.5 exposure to the guideline value is more straightforward. Below figure shows the 24-hour average concentrations combined with the guideline values.

PM2.5 24-hour average concentrations.

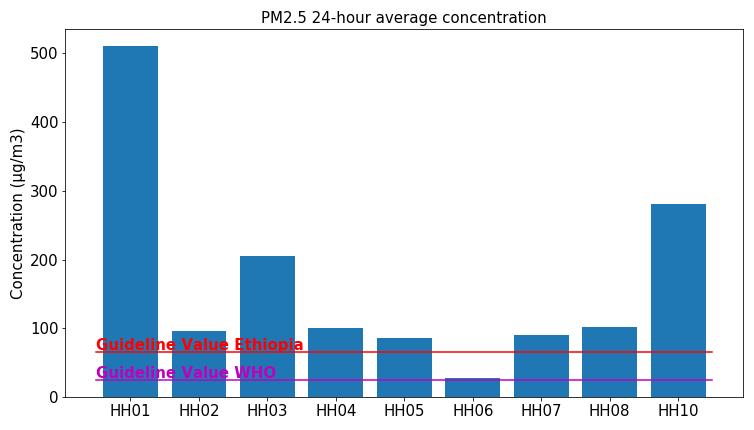
At all households, the WHO guideline value (25 μg/m3) is exceeded. Only for the participant from household 6, the Ethiopian guideline value (65 μg/m3) is not exceeded.

However, during the 24-hour periods there is a large variability. Periods of relatively low concentrations are mixed with moments of high concentrations. Below figures show the CO and PM2.5 concentration during the whole period, for each of the participants.

previous arrow
next arrow
previous arrownext arrow
Slider

Students measure high concentrations

Outdoor concentrations of PM2.5, CO and CO2 are generally about 10 μg/m3, 0.3 PPM and 450 PPM, respectively. However, close to air pollution sources and/or with circumstances of little ventilation, concentrations can be much higher. This is also witnessed by students of Arba Minch University. So far, they have set records of measured concentrations at 1,800 μg/m3 PM2.5 ( coffee ceremony) 1,040 PPM CO (student’s cafeteria kitchen) and 4.200 PPM CO2 (a closed dormitory with students present).

A student measuring PM2.5 during coffee ceremony

The measurements

33 groups of students from Arba Minch University (Bachelor studies Meteorology & Hydrology, year 2, and Water Supply & Environmental Engineering, year 4) are conducting a small air pollution measurement research. You can read more about this on the project page.

New Year’s Eve concentrations

Happy new year! On September 12, 2019, according to the Ethiopian calendar, a new year (2012 according to the Ethiopian calendar) has started. While in Ethiopia a change of years is not (yet) celebrated with much fireworks, it is thoroughly celebrated with delicious meals on New Year’s day. Of course, these meals will be prepared on the day before. Many of these meals are cooked on biomass fuel. This was visible on our Home Measurements location (see this project page for more information).

PM2.5 measurements
At the Home Measurements location PM2.5 is measured since August 23. The below graph shows half-hour averages between 17:00 and 2:00 (the next day) for August 23 – September 10, versus September 11 (New Year’s Eve).

On New Year's Eve the average concentration between 17:00 - 2:00 was 64 µg/m3, while on the other evenings this ranged from 10 - 39 µg/m3. Half-hour average PM2.5 concentrations were significantly higher on New Year's Eve than on any other evening (t(df:27)>=2.356, p<=0.013).

Doro Wot
The higher concentrations counted for something: on New Year's day we could enjoy delicious Doro Wot (chicken stew) at some of Arba Minch's most welcoming family homes.

Participate
You can download the raw data, or check the conducted data analysis. If you have any questions or suggestions, do not hesitate to contact us!

First measurement location

The first measurement location has been installed. An IQAir AirVisual sensor is placed at the front of the house of Geertje and Jan Dirk Dingemanse in Arba Minch, Ethiopia. With its user-friendly interface, the installation consists merely out of supplying power and Wi-Fi. If electricity is available, continuous measurements of PM2.5, CO2, Temperature and Humidity are conducted and logged. The time series will give an insight in the air quality, weather conditions and availability of electricity.

A description of the measurement location and realtime measurement data can be viewed on this page. On the same page, the time series data will (irregularly) be made available for download.

Measurement location

Ready for departure

The measurement instruments have been collected, almost everything is packed: Geertje and Jan Dirk Dingemanse are set to leave The Netherlands on August 2, and move to Arba Minch, Ethiopia, to join Arba Minch University. While Geertje will join the Department of Economics, Jan Dirk will set up Air Quality measurements together with the Faculty of Water Supply and Environmental Engineering, and the Faculty of Meteorology and Hydrology.  Within the coming months, the measurement instruments will be installed on different locations within Arba Minch, or used within courses at Arba Minch University.

Updates on Air Quality measurements within Arba Minch, as well as the measurement data itself, will be shared through ArbaAir.org.

Of course, if not for the best buna (coffee) of the world, the main reason for Geertje and Jan Dirk to move to Arba Minch, is  the beautiful view: