For the 10 participants of a pilot study, personal exposures to Carbon Monoxide (CO) and PM2.5 concentrations exceed guideline values. You can read more about these measurements on the project page.
Guideline values
The World Health Organization (WHO) advises a PM2.5 guideline of 25 μg/m3 as 24-hour average (source), while Ethiopia uses a guideline value of 65 μg/m3 as 24-hour average (Guideline Ambient Environment Standards for Ethiopia, 2003).
For CO, guideline values are given at shorter time average periods, as health effects from CO can be more direct. Both the WHO and Ethiopia use guideline values at averaging periods of 15 minutes, 30 minutes, 1 hour and 8 hours of respectively 90, 50, 25 and 10 PPM.
Measured CO exposure
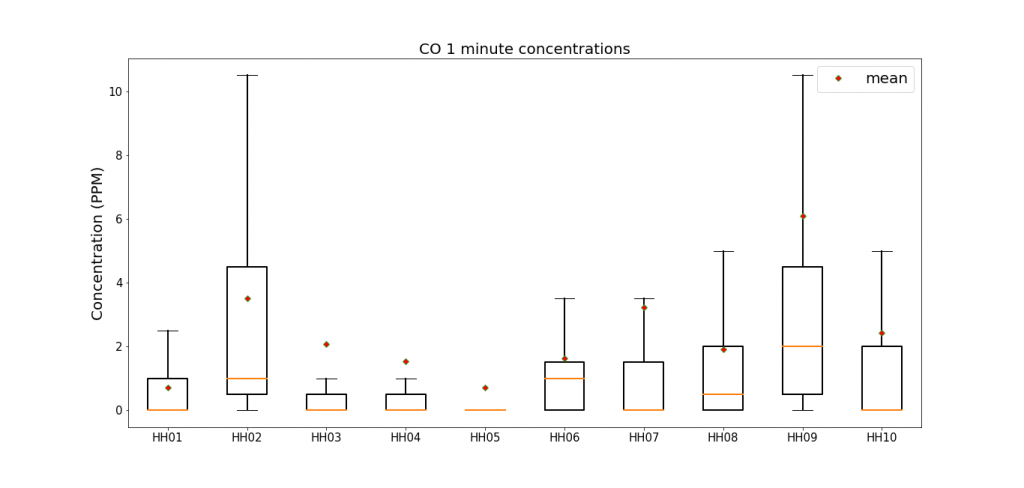
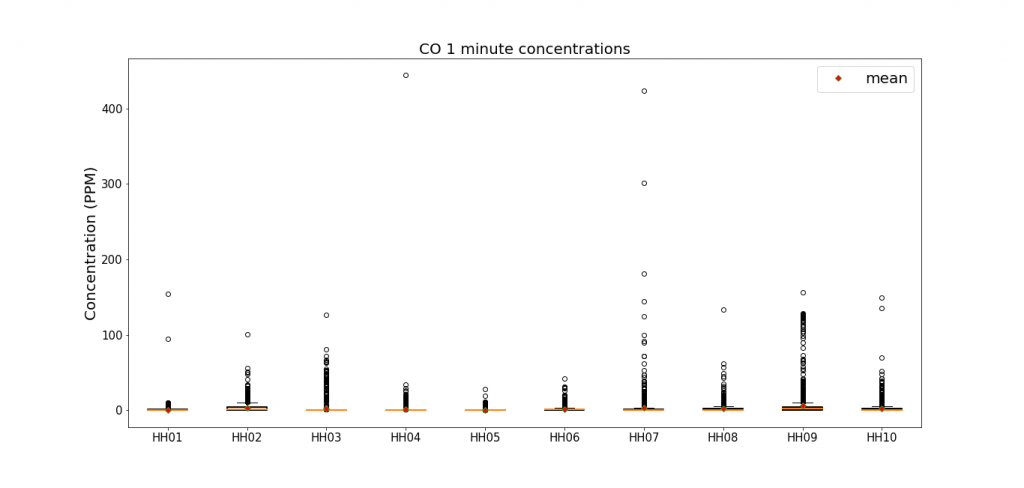
During the 24-hour measurements, peaks up to 400 PPM were measured. The figures show the measured CO concentration as boxplots for each of the participants, without and with values outside the whiskers.
24-hour average concentrations are below 6 PPM, and for all participants 75% of all data is lower than 5 PPM. There are however peak concentrations of sometimes up to 400 PPM.
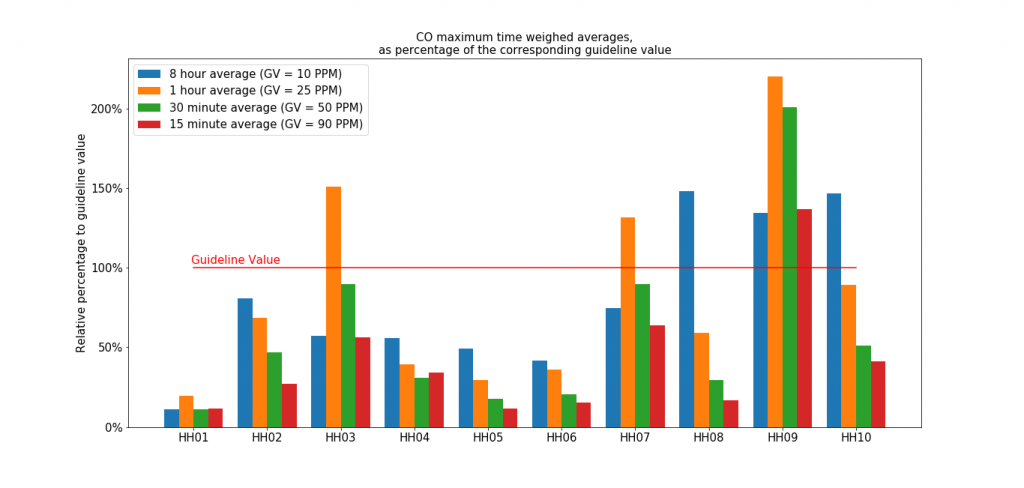
To compare the measured concentrations to guideline values, we have to use 15 minute, 30 minute, 1 hour and 8 hour average concentrations. Each of these time averaging period have their own guideline value. To compare them in one graph, the below graph shows the highest average value of each of these time periods, relative to the guideline value for that averaging period. Averaging concentrations higher than 100% imply that the concentration exceeds the guideline value.

Measured PM2.5 exposure
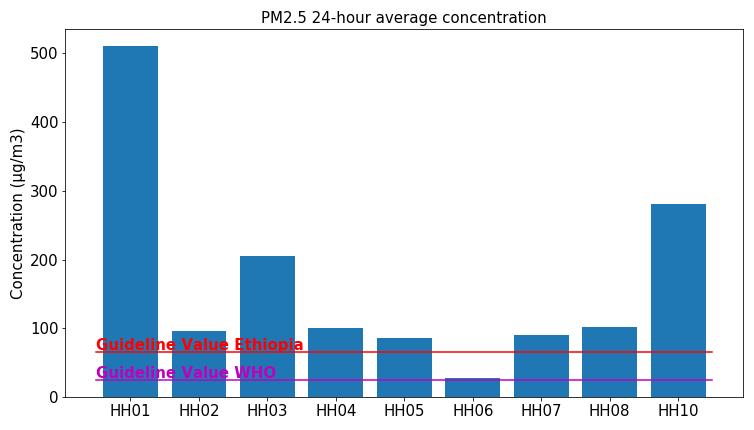
Comparing the measured PM2.5 exposure to the guideline value is more straightforward. Below figure shows the 24-hour average concentrations combined with the guideline values.

At all households, the WHO guideline value (25 μg/m3) is exceeded. Only for the participant from household 6, the Ethiopian guideline value (65 μg/m3) is not exceeded.
However, during the 24-hour periods there is a large variability. Periods of relatively low concentrations are mixed with moments of high concentrations. Below figures show the CO and PM2.5 concentration during the whole period, for each of the participants.


