Posts

Gravimetric measurements in Arba Minch

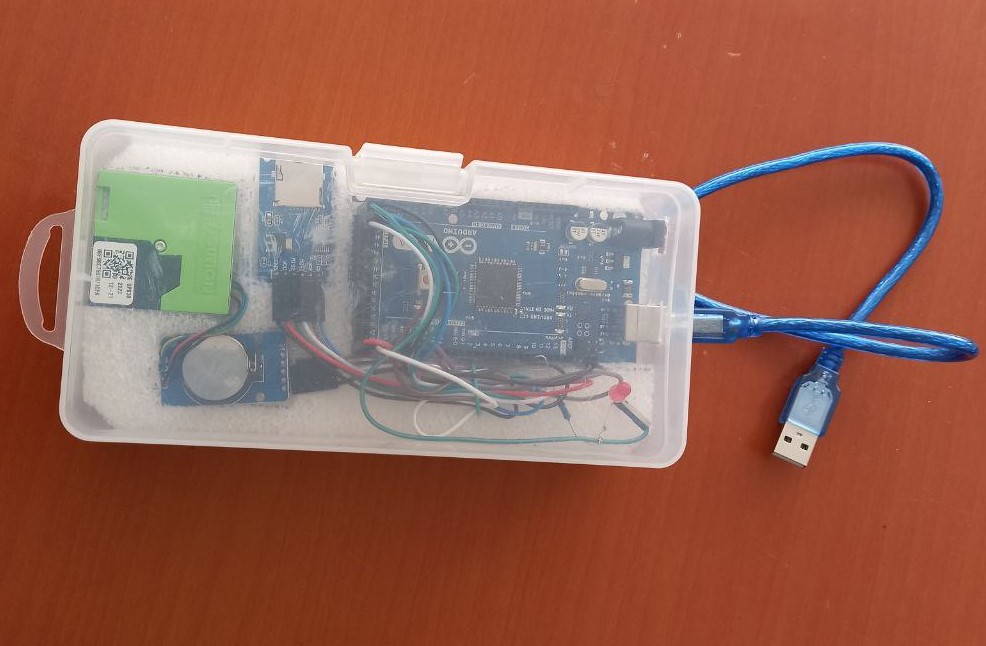
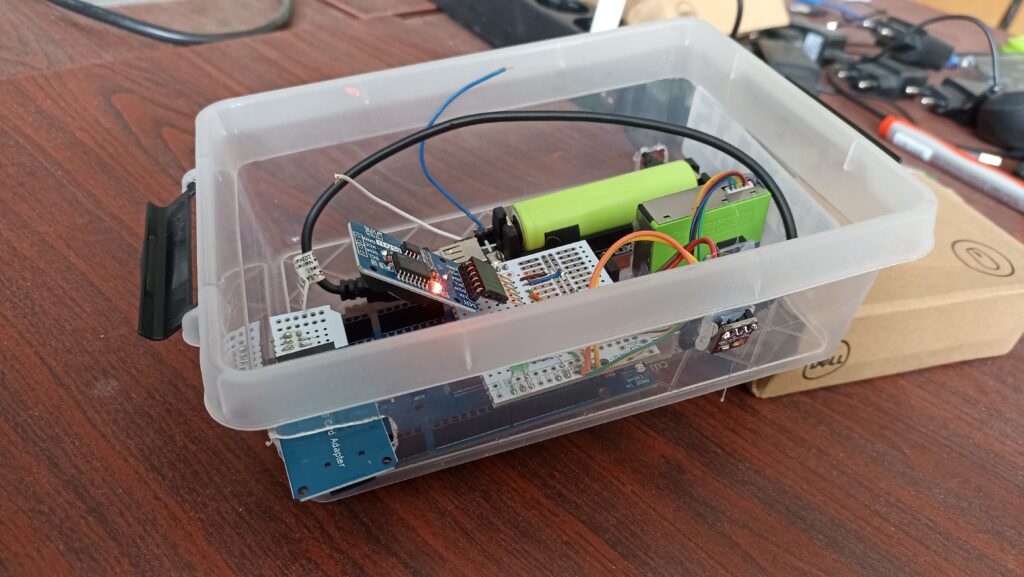
I develop and use a low-cost sensor system (the SPSA), but validation of such a system under the circumstances where you use it is also important. The golden standard for validation of PM2.5 measurements in mass concentration (microgram/m3) are gravimetric measurements.

Gravimetric measurements

The principle behind gravimetric measurements is very simple: take the weight of an empty filter, expose that filter to air of your interest, and afterwards again take the weight of the filter. The weight increase is the particle mass. If you know the volume of air from which this mass comes, you can calculate the mass concentration.

While the principle is simple, the execution is less so. Four considerations:

1. Analytical scale

You need an analytical scale that has a precise enough readability and repeatability. If the increase in filter mass is, say, 450 microgram, but your analytical scale only reads up to 0.0001 gram (or 100 microgram), it will tell you either 500 or 400 microgram. Uncertainty resulting from the readability would then be 100/500 = 20%. And, the repeatability (within which range will a scale tell the same with the same weight) is usually less precise.

2. filter sampling Instrument

You need an instrument that can pull air through a filter at a known rate. In other words, a pump (pulling air through a filter), with a logger of the volume of pumped air. Because, apart from the filter weight increase, we need to know the volume of air pulled through the filter.

3. pm2.5 sampling

For PM2.5 sampling, you only want particles with an aerodynamic diameter up to 2.5 micrometer to arrive at the filter. Hence, your sampling instrument will need some preselector based on particle size. This is usually some precise combination of inlet diameter and distance within which the airflow takes a turn. Particles too big cannot follow the turn, and are therefore taken out before the airflow reaches the filter. This, however, does require your instrument to have a constant flowrate. The particle size cutoff is related to the speed of the airflow, so that speed needs to be maintained – otherwise you will get other sized particles than you expected.

4. Sampling time, flowrate and scale

Given the precision of the analytical scale, you need an instrument that has a good flow rate in relation to the average concentrations. Preferably the repeatability of the scale is less than 5% of the expected filter weight. If the repeatability is for example 20 microgram, you would want to have at the very least an expected filter load of 400 microgram. If expected concentrations are on average 20 microgram/m3, and you want a sampling time of 24 hours, then your instrument would need to have a flowrate of at least 0.83 m3/hour.

Instruments in Arba Minch

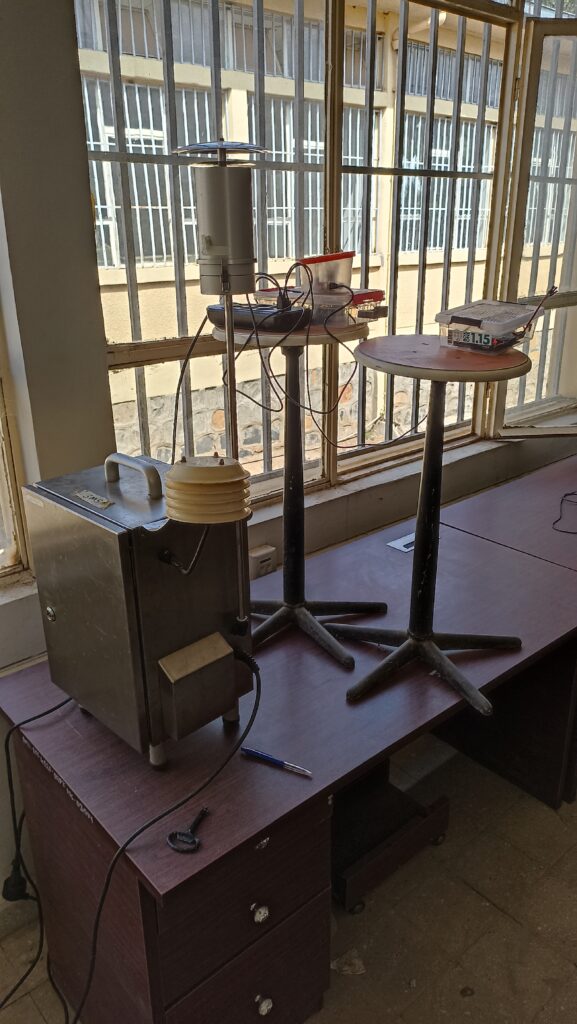
In my air quality lab, I have a Mettler Toledo AE240 analytical scale, which has a readability of 10 microgram and repeatability of 20 microgram. Furthermore, I have an LVS Leckel with PM2.5 inlet, which has a controlled flowrate of 2.3 m3/hour. This means, that for an outdoor concentration of 10 microgram/m3, with 24 hours of filter loading the filter weight increase would be 10 microgram/m3 * 2.3 m3/hour * 24 hour = 552 microgram. The repeatability of the scale is 20/552 = 3.6%, which is acceptably low. So far, so good. However, now on to more advanced considerations.

Gravimetric measurements, continued

While having the right instrument and analytical scale, there can be other sources of error. Three advanced considerations:

1. Checking the flow

Kytola flow sensor

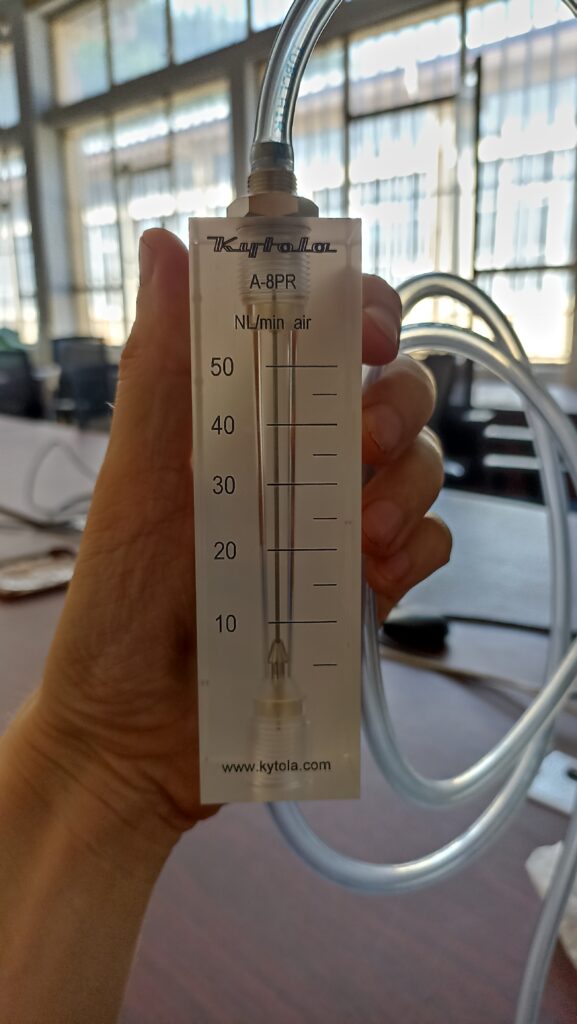
The flow of the LVS is supposed to be 2.3 m3/hour. However, this needs to be checked, and if necessary, calibrated. This leads to the need of another instrument: a flow sensor – which on itself needs to be trusted and/or calibrated of course. The only flow sensor I have is a Kytola hand-held plastic tube, which has a scale in L/min, per five liter.

2. Humidity effect

From the analytical scale, we can trust weight changes beyond 20 microgram. However, changes in room conditions (specifically relative humidity) influence the condensation or evaporation of water onto or from the filter. These changes can result in weight changes beyond 20 microgram. The expensive solution for this is a controlled weighing room, with a stable temperature and relative humidity. This is not available in Arba Minch. The cheaper solution is to always have three empty filters together with the filters of interest. Any changes in empty filter weights must be due to humidity effects. We can correct the weight change in a loaded filter for this. The use of three (or more) filters is to be able to exclude one faulty value.

3. Loaded filter effect

When the filter is loaded, its weight might change over time. Possibly, PM2.5 components react away, or others increase. This would imply it matters how soon after sampling you take the weight. And if this indeed matters, then a sampling campaign with seven filters and afterwards weighing these would see an influence from whether a filter happened to be first or last.

Measurements with students

Together with third-year Water Supply and Environmental Engineering students, I have used the LVS and analytical scale over the past month for validation of the SPSA.

So far, across 28 weighing moments, 194 times filters (empty or filled) were weighed. 15 filters were loaded; eight in a lab and seven outside. Let’s dive into the three sources of error, with help of the past month’s measurements.

Evaluating the advanced considerations

1. instrument flow

I have checked the flow of the LVS five times, and each time the Kytola flow sensor seems to show a reading somewhat under the 35 L/min mark (say: 34 L/min). This would imply a flowrate of 34 * 60 / 1000 = 2.04 m3/hour, instead of the required 2.3 m3/hour. I do not yet want to calibrate the flow of the LVS before I get confirmation from another flow sensor. While waiting for this, let us calculate the implications. There are two implications of a wrong flow: the volume is different, and the particle size cutoff is different.

1.1 Volume implications of a wrong flowrate

While sampling for 24 hours, if I have collected a filter weight increase of 900 microgram, this would imply a mass concentration of 900 / (2.3 * 24) = 16.3 microgram/m3 with the normal flowrate. If, however, the flowrate was 2.04 m3/hour instead, the concentration would be in fact 900 / (2.04 * 24) = 18.4 microgram/m3.

At the one hand important to know, but at the other hand not too problematic: as long as I keep the data, I can correct it as soon as I am confident of the correct flow. If the flowrate is indeed 2.04 / 2.3 = 89% of what it should be, then the concentration inversely proportional increases with 1 / 89% = 113%. In other words: I need to get to know the correct flowrate for final results, but by having measured potentially with a wrong flow rate, I have not made the data useless.

1.2 Cutoff implications of a wrong flowrate

The size cutoff, however, might be more problematic. I am using this instrument to validate the PM2.5 measurements of the low-cost sensor system. The LVS is designed to have a cutoff at 2.5 micrometer if the flowrate is 2.3 m3/hour. If the flowrate is lower, the speed of the air is lower, and it becomes easier for bigger particles to make the turn. In other words, we might be measuring PM>2.5 instead of PM2.5.

We can calculate this. The expected cutoff is a function of the inlet diameter, the flowrate (Q), and some other physical parameters and constants. All else equal, the expected cutoff is a function of √(1/Q). If the flowrate is 88% of what is expected (2.04 instead of 2.3 m3/hour), the expected cutoff increases with √(1/0.88) = 107%. An original cutoff of 2.5 micrometer at 2.3 m3/hour would imply a cutoff at 2.5 * 1.07 = 2.67 micrometer at 2.04 m3/hour. I do not expect that the mass concentration of PM2.67 significantly differs from PM2.5. Hence, I conclude that the possible incorrect flow rate is not a problem with respect to the cutoff.

2. Humidity effect

2.1 Is there a humidity effect?

Possibly, conditions in the weighing room affect the filter weight, by increasing or decreasing the condensed water on the filter. To control for this, three blank filters with any field filter are used: at the before- and after-weighing of the field filter, the blank filters are weighed as well. Any change in weight of the blank filters can only be from a change in weighing room conditions, and the field filter weight change should be corrected for this.

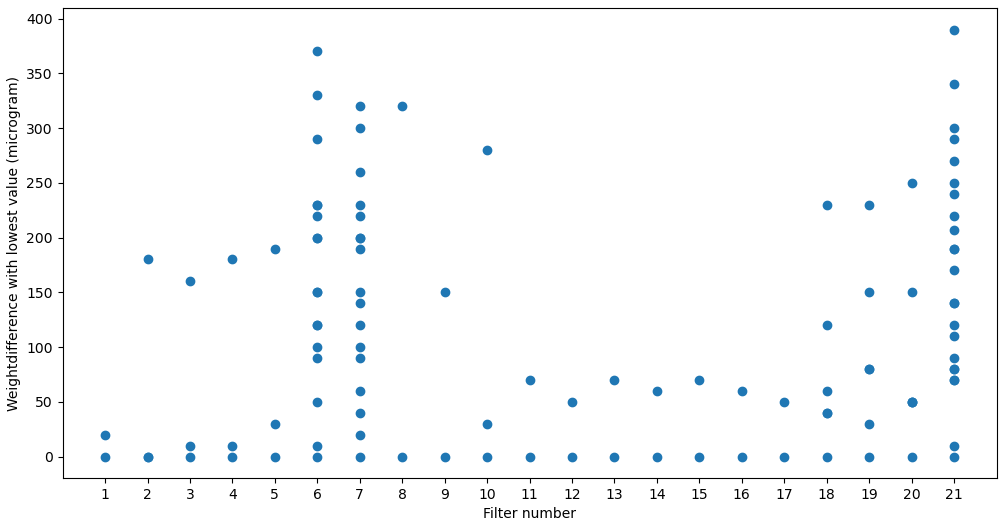
Below figure shows filter weights of empty filters weighed multiple times over the past two months – normalized by subtracting the lowest weight per filter. As we can see, variations per filter across different weighing moments can be up to 360 microgram. This means that, for the same filter, with the same scale and in the same room, still the weight changed significantly. It makes sense that we correct for this effect.

Filter weights of 21 empty filters, relative to the lowest measured weight. We weighed filters multiple times. For this figure I subtracted per filter the lowest weight from all measured weights of that filter.
2.2 Can we correct for the humidity effect?

There were 28 weighing moments. Per combination of two moments, we can establish a likely humidity effect, if there were three or more the same blank filters weighed at both moments. We take the weight difference per filter between moment 2 and moment 1, then remove the most extreme differences, and use the average of the remaining differences as correction for any weight comparison between these two moments. The range between these remaining differences (highest – lowest value) tells us something about how stable this humidity effect is across filters.

For example: at moments 1 and 2, three the same blank filters were weighed. At moment 1, weights were respectively 152880, 153320 and 152550 microgram. At moment 2, weights were respectively 152930, 153290 and 152530 microgram. Weight differences were respectively 50, -30 and -20. The most extreme difference is 50 (it differs the most from the average difference). After removal of this value, an average correction of -25, with a range of 10 microgram, is calculated. 

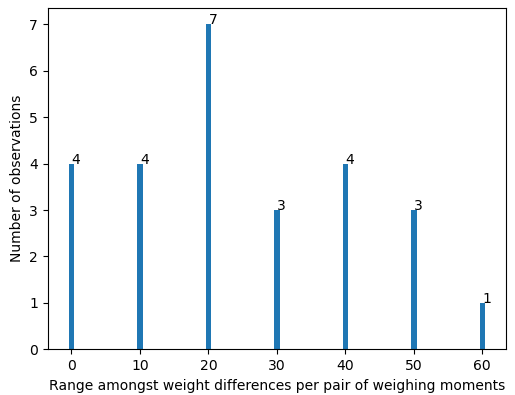
There were in total 231 pairs of weighing moments with three or more of the same blank filters. Below figure shows the range between remaining differences.

The range (highest minus lowest value) amongst weight differences for empty filters across pairs of weighing moments.

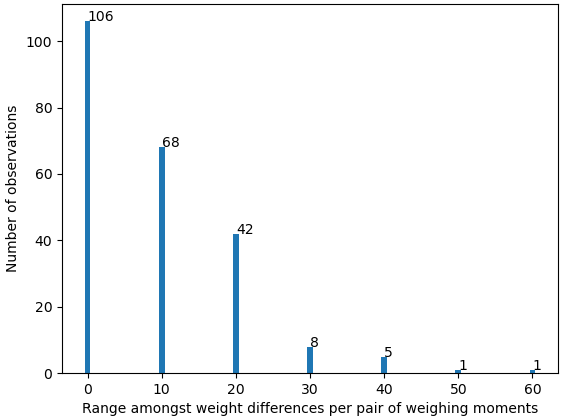
Of the 231 pairs, only 15 (6%) have a range higher than 20 microgram amongst them. Overall, the range across weight differences for pairs of weighing moments is much smaller than the range of filter weights across weighing moments. In 94% of the cases, multiple filters confirm the required correction within a range of 20 microgram from each other. And 20 microgram of difference can simply be due to variations of the analytical scale, since that is its repeatability. In other words: it makes sense to correct for the humidity effect, since several filters confirm it.

3. Loaded filter effect

3.1 Is there a loaded filter effect?

Possibly, there is a change in the weight of a loaded filter over time. If this is the case, then for loaded filters across different weighing moments, the range in differences should be more extreme than that for empty filters.

There were in total 26 pairs of weighing moments with three or more of the same loaded filters. Below figure shows the range between remaining differences.

The range (highest minus lowest value) amongst weight differences for loaded filters across pairs of weighing moments.

Of the 26 pairs, 11 (42%) have a range higher than 20 microgram amongst them. In other words: the differences across weighing moments for loaded filters have a larger spread than the differences for empty filters – for which only 6% of the differences within the same paired weighing moments were more than 20 microgram apart. So, indeed, it seems that the filter weight of a loaded filter changes more than can be explained by the humidity effect only. It is possible that the humidity effect is different for loaded filters, or that the PM2.5 load increases or decreases over time.

3.2 Is there a trend in the loaded filter effect?

Let us try to see whether there is a trend in the weight change of loaded filters over time. For that, we take a couple of steps: (1) we calculate for each loaded filter, for every moment of weighing, the likely PM2.5 load based on the weight difference with when the filter was empty. (2) We correct each of these PM2.5 loads based on the most likely humidity correction. For example, if we took the empty weight of filter x at moment 1, and the loaded weight at moment 5, we correct the weight difference for the difference of filters that were empty at both moments 1 and 5. (3) We compare the loads with the time difference between the moment of loaded weighing and end of sampling.

Below figure shows the weight of twelve loaded filters that had at least three loaded weighing moments. Instead of showing absolute weights, I subtracted the first weight of a filter from all weights of that filter. divided weights by the first weight of the respective filter. In other words, the figure shows the difference over time relative to the first weight measurement.

Filter load weight, relative to the first measured filter load, over time in hours between sampling and weighing.

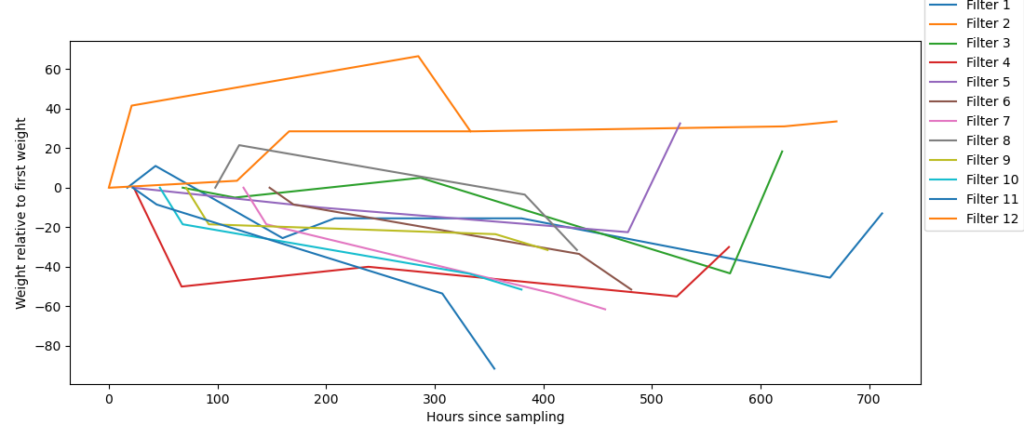
Looking to all filters, there is no clear trend of decay or increase. Some filters show decrease at some point, while others show an increase. Except for filter 11, all changes are within 60 microgram difference. Filter 11 was one of the most heavily loaded filters. Relative to the filter weight, differences are between 0.94 and 1.06, or +- 6%. It seems, at this point, that we mostly can conclude that the variation in filter weight for loaded filters is bigger, but that there is no clear trend or likely correction with respect to hours after sampling.

Conclusions on gravimetry

What I conclude, so far, on the use of gravimetry in Arba Minch:

  • I will look for another type of flow sensor, to get confirmation on the flow of the LVS. A possible error in the flow, however, does not mean that we cannot use samples taken so far.
  • Missing a controlled weighing room, correcting for room conditions and a humidity effect is important. Several pairings of empty filter weighing moments confirm that a stable (within reliability of the analytical scale) correction for this is possible.
  • The moment of weighing a loaded filter, and the time period between end of sampling and weighing, might matter. Current evidence does not give a clear trend and possible correction. For now, we must see this as a +-6% uncertainty.

Introducing Israel Gebresilasie

Earlier I wrote about seven student science projects that are started this year as a pilot. This post introduces my colleague Israel Gebresilasie, who works on one of those projects.

Personal information

My name is Israel Gebresilasie Kimo (ORCID profile). I have a BSc in Meteorology and Hydrology and an MSc in Climate Change and Development. I am currently working as a lecturer and researcher at the Faculty of Meteorology and Hydrology, Water Technology Institute, Arba Minch University, Ethiopia. I am interested in conducting research in air quality, low-cost meteorological sensors, meteorology, and climate change.

Israel Gebresilasie

I am conducting research as a principal investigator on validating the performance of low-cost meteorological sensors. I am working on this project alongside my colleagues Mr. Yared Gudine, Mr. Awel Haji, Dr. Abebe, Mr. Jan Dirk, and our students. We integrate the courses Meteorological Observation, Atmospheric Chemistry and Air Quality, and Data Analysis in Meteorology and Hydrology for second- and third-year students with project activities.

Project information

The quality and quantity of data are essential for any research in meteorology. This data significantly influences research outcomes as well as the accuracy of model outputs. The better the observational data we have, the better the weather predictions produced by numerical models, and vice versa.

In addition to this the density of this data also plays a significant role. However, meteorological stations in most African countries has large distance between them, and increasing their density requires high costs. Ethiopia is one country experiencing this situation. The development of low-cost meteorological sensors has provided a potential solution. As these sensors are affordable, they allow for the collection of denser data on a limited budget. However, while we are addressing the quantity issue it is important to focus on data quality.

This research has two main objectives. The first is to address the quality issue by validating the performance of the low-cost sensor BME280 for three meteorological variables: temperature, relative humidity, and particulate matter (PM2.5). We will perform validation using conventional meteorological instruments, such as a thermohygrograph(placed in Stevenson screen as recommended by worled meteorological organization ) for temperature and relative humidity, and filter-based gravimetry methods for particulate matter.

The second objective is to engage students in practical learning by having them help in collecting meteorological using data both the low cost sensor and conventional instruments, analyzing the data using Python, and plotting and interpreting the results to draw meaningful conclusions. This approach not only contributes to scientific research but also improves the practical skills of our students.

PM and gas sensor constructed

I constructed a simple PM and gas sensor system with the Sensirion SEN55 and Arduino. Last year I brought four SEN55 sensors, but until now I did not use them. As part of the 2024/2025 student science pilot project, Firew Deneke and Seguye Shamena plan to let their students study air filtration techniques in chemistry laboratories on Arba Minch University Abaya campus. As part of this, they will use the SEN55 for measurement of PM, VOC and NOx. For this reason, I constructed a very basic sensor system: the SEN55, a DS3231 real time clock, and an SD module for data storage.

The components are all connected to an Arduino Mega microprocessor. I included a green LED to show the status. Jumper wires and a small breadboard connect all components. A lunch box serves as case. This is a low-cost sensor system: the total price of all components combined is approximately 40 euro.

As for software, I programmed the system to write data to the SD card and blink an LED every ten seconds. I shared the software on my GitHub repository. As soon as the system is connected to power, it starts to measure. Apart from PM, VOC and NOx, it also reports temperature and relative humidity.

I have not yet tested the SEN55. For VOX and NOX, there are no reference instruments available. For now, we will have to make do with quality inferences from literature and what the manufacturer provides. As an added quality check, Firew and Seguye will collocate multiple sensor systems together. In that way, at least the intra-correlation can be evaluated.

First permanent measurement locations in Arba Minch

Yared Godine and I have installed the first four permanent PM2.5 measurement locations in Arba Minch. The locations are part of a planned low-cost measurement network. We have installed SPSA sensor systems at the Arba Minch University (AMU) main campus gate, at the AMU Kulfo campus gate, in the Limat neighborhood, and at the main commercial bank (CBE) compound in the center of Arba Minch. The sensor system measures PM2.5, relative humidity and temperature on a one-minute frequency. It stores the data on an SD card.

We plan to install sensors at six other locations over the coming weeks. The locations will be at the main hospital, at the bus station, in some neighborhoods, and near to a busy road.

Low-cost installation

A low-cost measurement network goes further than merely using low-cost sensors. We have conducted low-cost field installation as well. Yared Godine, staff of Meteorology and Hydrology, has many years experience with setting up weather stations. He is incredibly creative with waste materials, and has good connections with workshops at Arba Minch University. The following are some of the ideas that went into the field installation:

  • Protective boxes were created from unused computer stand carts;
  • Discarded metal sheets and pieces were used for rain protection and hanging the boxes;
  • Individual copper wires of discarded internet cables were used to make power available.
Slider_1

Unused computer stand carts are turned into protective boxes

Slider_2

Parts of discarded sheet metal are turned into rain covers

Slider_3

Yared’s good connections at the workshops make for quick help on all the metal work.

Slider_5

Discarded power sockets are prepared for field installation.

Slider_6

Interested audience are quick to help with installing the power supply. Copper wires of old internet cables are used.

previous arrow
next arrow

Yared’s connections at the workshops made for quick metal work, and interested audience at the installation locations made for helpful support. The final ‘costs’ for installation were approximately 400ETB ($3.50) for a shared lunch and coffee.

Low-cost operation

With staff from different faculties, we aim to run the measurement network with student science. Students from electrical engineering, meteorology and hydrology, environmental sciences and environmental health will maintain instruments and collect, process and analyze measurement data, as part of their respective courses.

Student science pilot project presentations

On October 4, 2024, seven project teams gave presentations on their student science plans to Arba Minch University (AMU) management, deans and research directors. We were invited as first agenda point of the Research and Development Committee (RDC) meeting.

Presenting one of the student science projects to the RDC

I coordinate the 2024/2025 student science pilot project. It is hosted by the office of the Vice President of Academic Affairs (Dr. Alemayehu Chufamo). In June, we distributed a call for university staff to submit a plan on turning part of a course into a research project. Seven teams reacted to the call, submitted plans, and gave a short presentation of their plans to the RDC. After these presentations, there was a one-hour discussion on possibilities and challenges for student science.

The projects

Over the past five years, I have applied student science for air quality research. The pilot project will be a test of the hypothesis that the same can be done in other fields as well. Seven project teams aim to turn one or more undergraduate courses into a research project. The topics cover different fields (engineering, natural science, social science). Combined, they will provide good insight into what is possible (and what not) with student science. Below, I give a short description of each of the projects.

1. Flood modelling of kulfo river using hec-ras

  • Course: Software in Hydraulic Engineering
  • Students: Year four students of Hydraulic and Water Resources Engineering

Bereket Dora and Muluneh Legesse plan to turn part of the course Software in Hydraulic Engineering into data collection and the use of this data for flood modelling with the HEC-RAS model. Students will be trained in data collection, go to the river Kulfo to collect data, and use this data as model input.

2. Investigating the quantity of water loss and its impact on water demand coverage: the case of AMU main campus

  • Courses: (1) Urban Water Supply Engineering, (2) Water Supply and Treatment
  • Students: Year four students of Water Supply and Environmental Engineering, year four students of Hydraulic and Water Resources Engineering

Deberge Beyene, Kinfe Bereda and Dr. Zelalem Abera will use part of two water supply courses to let students study water loss and its effects on water coverage at Arba Minch University main campus. Parts of the courses deal with water supply systems and water loss. Students will apply this knowledge to assess the water supply system and measure water loss on campus.

3. The affirmative action for women in ethiopian higher education institutions: the case of AMU

  • Course: Sociology of gender
  • Students: Year four of Sociology

Dr. Endrias Liranso will use part of the course Sociology of gender to let students study the application and effects of affirmative action for women at Arba Minch University. The focus will be on female staff and students at AMU Chamo campus. Students will design questionnaires, conduct interviews and focus group discussions, and analyze the data qualitatively and quantitatively.

4. Assessment of air quality in selected chemistry laboratories and development of cost-effective portable activated carbon based lab air purifier

  • Course: Thermal and mass transfer unit operations
  • Students: Year four of Industrial Chemistry

Firew Deneke and Seguye Shamena will use part of the course Thermal and mass transfer unit operations to let students study the air quality during lab experiments, evaluate current air filtration efficiencies, and synthesize and characterize activated carbon.

5. Investigation of the Effects of Different Growth Regulators on Micropropagation of Potato (Solanum tuberosum) via Tissue Culture Techniques

  • Course: Senior year project Biotechnology track
  • Students: Final year students of Biotechnology

Kidist Ali, Yonas Syraji, Dawit Albene and Dr. Ashenafi Hailu will use a senior year project to let students study the effects of different growth regulators on a local potato culture. Students will collect samples, prepare them in the lab, expose them to growth regulators and monitor the growth.

6. Determination of harmonic pollution indices and load unbalacing factor for transformers supplying non-linear loads

  • Course: Power Electronics
  • Students: Year four students of Electrical and Computer Engineering.

Dr. Yalisho Girma, Andinet Anjamo and Zeleke Ginto will use part of the course Power Electronics to let students study the effects of unbalanced power loads on the AMU main campus power supply. Students will collect data during moments of expected high (and variable) load.

7. Integrating Practical Training in Data Collection, Analysis, and Interpretation with Sensor
Performance Assessment : A Case Study on Temperature, Humidity, and PM2.5
Measurements

  • Courses: (1) Hydrometry and Meteorological Observations, (2) Atmospheric Chemistry and Air Quality, (3) Data Analysis in Meteorology and Hydrology
  • Students: Year three students of Meteorology and Hydrology

Israel Gebresilassie, Yared Godine, Awel Haji and Dr. Abebe Kebede will use parts of three courses of Meteorology and Hydrology (MH) for data collection and data analysis of low-cost air quality sensors. As part of a project to set up a low-cost measurement network, sensor systems will be installed across Arba Minch. Students of MH will collect and analyze data from these sensor systems, with a special focus on the meteorological parameters. They will validate the relative humidity and temperature measurements with reference instruments, evaluate variation of meteorology across town (and the representativeness of a single meteorological station), and study the relation between the meteorological parameters and the PM2.5 measurements.

PhD student uses SPSA

Merga Assefa, a PhD student of Jimma University, uses the SPSA in his research. He measures PM2.5 at local alcohol producers in a town in western Ethiopia. Afework Tademe, my colleague from Electrical Engineering, built ten sensor systems last June. Of the total ten, he would use four instruments to collocate multiple SPSA, for evaluation of intra-correlation. Merga also loaned my three UPAS instruments, to conduct validation measurements with the gravimetric method. My personal interest is to gain more data on the quality of the SPSA. For that reason, Merga only paid a construction fee of 500 ETB per piece for six SPSA. He took the additional four SPSA and three UPAS for my data interest and therefore free of charge. In this way, a PhD student accessed measurement instruments for some months, for total costs of only 3000 ETB (30 euro).

(Non-)user friendliness of the SPSA

This was the first time someone from outside Arba Minch University used sensor systems constructed by us in Arba Minch. Both Merga and I miscalculated the required time for instructions. Merga left Arba Minch soon after receiving the sensor systems. Only in the field he realized the questions he would have liked to ask in Arba Minch. The SPSA has no user-friendly screen and buttons, no vandal-proof 3D-printed encasing, and no user manual. For measurements under my direct supervision, I quickly recognize and resolve potential errors. Afework conducts small repairs on the spot. For Merga, it was the first time working with measurement instruments, under conditions with (almost) no availability of electricity, and far from Afework and me. This resulted in some SPSA becoming unusable during Merga’s measurement period, and some data loss.

Upon Merga’s return I certainly took some lessons in what additional instructions are required, and what hardware and software changes can be made to the SPSA to make it better usable for non-experienced users. However, I give a strong preference for a low-cost instrument that forces the user to think on its feet, and gain experience from trial and error, over an expensive, over-developed black-box instrument that works but keeps all experience for the developer alone. In my opinion, the Ethiopian research community is served better by requiring them to find things out for themselves (say learn by doing), than by large funds supplying expensive full solutions.

And, despite the challenges, Merga collected some 350 hours of 10-second PM2.5 data. Possibly, this could have been double if he would have had ten commercial sensors. I leave it up to the reader to decide what is better: 350 hours for 30 euro, or 1,000 hours for 2000-3000 euro?

Debre Birhan University team constructed PM2.5 sensor system

Last March, Professor Solomon Bililign donated thirty SPS30 Sensirion sensors, with the goal that apart from Arba Minch University at two other universities teams would start building PM sensor systems. A team at Debre Birhan University (DBU) constructed their first working sensor system. The team consists of Abebe Tsegaye, Abreham Lakew and Matiwos Zenebe, staff of Electrical and Computer Engineering. With their sensor system, PM2.5 data from the SPS30 Sensirion, together with time from a DS3231 real time clock, is stored on an SD card.

The DBU team received ten of the donated SPS30 sensors. They received build instructions and the sensor system software from me. The have added all other components and work from their own time and budget. It is a promising sign that the university team has done all this without any external project funding. While any future upscaling might make fund applications relevant, the DBU team is already showing and increasing their expertise. This makes any future fund applications more likely to succeed, but also shows that DBU can act independently.

The DBU team will install sensor systems at outdoor locations in Debre Birhan. They will install the first systems at campus and the university hospital. Other locations are planned close to industry and next to roads.

Six sensor systems brought to Addis Ababa

I have brought six SPSA sensor system to Addis Ababa. Tesfaye Mamo, staff of the department of Physics at Addis Ababa University, will collocate them over the coming weeks at some ground measurement locations of the MAIA mission in Addis Ababa.

Tesfaye Mamo operates various air quality measurement locations in Addis Ababa, and can install six SPSA sensor systems at some of those.

Earlier, we tested the SPSA in Arba Minch, as well as at Ethiopian Meteorology Institute stations of Addis Ababa and Adama. Part of this data has been published. The new sensor systems will collect PM2.5 data next to Purple Air sensors (commercial low-cost sensors). Comparison of the data will show whether the SPSA sensor systems can produce data as reliable as (or even more reliable than) the Purple Air sensors. If this is the case, air quality monitoring capacity in Ethiopia could be increased with locally constructed sensor systems rather than commercial ones from outside. This would result both in cost reduction and local expertise increase.

Update of low-cost sensor software

Anticipating an increase in Arduino-based PM sensor systems, I have made an update in the low-cost sensor software code. I also shifted to another sensor identification system. So far, I used for my measurement instruments a four-letter abbreviation (e.g. SPSA for the Sensirion SPS Arduino sensor, IQAV for the IQAir Airvisual Pro), in combination with a two-digit identifier (e.g. SPSA01, SPSA02, …). This system accommodates a maximum of 100 unique identifiers per instrument type.

I have used up to 33 so far. Since my presentations in Addis and publication, some other persons and organizations have expressed their interest. We built ten sensor systems for a PhD student last June. A team at Debre Birhan University has recently built their own system according to our design. I plan to install some ten sensors in both Arba Minch and Addis Ababa the coming year. I am in discussion with universities across Ethiopia for building and/or using the sensor systems as well. Hence, I have decided to shift to the following naming convention: SPSA_XXXX (SPSA as four-letter abbreviation of SPS30 Sensirion with Arduino, XXXX being four digits).

Most recent sensor system build: SPS30 Sensirion sensor, BME280 sensor, DS3231 real-time clock and SD module connected to an Arduino Mega. The system is powered by a Li-Ion 18650 battery. See an overview of the components on this page.

The software

Apart from the naming convention, I have made the following changes versus the earlier software versions:

  • Apart from a datafile, the sensor system also creates a metadata file. In the metadata file, for every restart of the sensor system it adds a line with the time, software version, device ID, serial number of the SPS30 Sensirion sensor, and the sensors of that specific SPSA.
  • As data from the SPS30, not only PM values (PM1, PM2.5, PM4, PM10), but also particle numbers of the separate bins are saved.
  • I have included a start-up sequence: first 50 seconds of low power mode, after which 30 seconds of SPS30 cleaning mode. I introduced the low power mode for the use of a Li-Ion 18650 rechargeable battery with battery shield as power bank. When the Li-Ion battery is fully depleted, and power comes back, the sensor system at the very start draws too much power. It therefore does not manage to start at all. Instead, at the moment the power comes back, the sensor system should start at low power. Within 50 seconds, there is some charge back in the battery, with which the system can start.

You can find the sketch (Arduino software code) for the set-up here. The sketch is for the following configuration:

 * SPS030......Mega
 * 1 VCC.......5V
 * 2 SDA.......SDA (nb: with 10k pull up resistor, or other I2C sensor)
 * 3 SCL.......SCL (nb: with 10k pull up resistor, or other I2C sensor)
 * 4 Select....GND (select I2c)
 * 5 GND.......GND
 *
 * BME280......Mega
 * VIN.........5V
 * GND.........GND
 * SDA.........SDA
 * SCL.........SCL

 * SD module...Mega
 * GND.........GND
 * VCC.........5V
 * MISO........50
 * MOSI........51
 * SCK.........52
 * CS..........53
 *
 * DS3231......Mega
 * GND.........GND
 * VCC.........5V
 * SDA.........SDA
 * SCL.........SCL
 * 
 * Green LED....Mega
 * +............8 [+: longer leg]
 * -..resistor..GND [-: smaller leg]

Display for the prime minister

On a fair, my work together with that of several colleagues was on display for the prime minister. The Ethiopian prime minister (Dr. Abiy Ahmed) visited Arba Minch for the inauguration of a new hospital. Part of his schedule would also be a visit to Arba Minch University Main Campus, where work of Arba Minch University (AMU) would be on display on a fair. AMU asked me to present my work in one of the tents. Some fourteen tents showed locally developed products from false banana and the water hyacinth, fertilizer, a soap making machine, a hand-held plow, meteorology sensors. In mine, I displayed low-cost sensor development: the low-cost PM sensor systems and the soil-moisture sensor system.

Below photos give an impression of the display.

44_IMG_20240704_123053
44_IMG_20240705_112405
44_IMG_20240705_114802
44_IMG_20240706_135446
44_IMG_20240707_121829
previous arrow
next arrow

The display was intended for the prime minister. He did however not visit the fair after all, due to scheduling conflicts. In his stead, higher officials and previous university presidents visited the fair, as well as university staff and students, and several Arba Minch citizens. The fair was kept in place from Thursday July 4 to Sunday July 7. It was open to anyone visiting the university during that time. It was good to see work of colleagues, and to show my work to them and the other visitors.

Student science

While my display was labeled ‘Low-cost sensor development’, I sneaked in some information on student science as well. Both the local development of sensor systems, and using courses to conduct research with students, are means for reducing costs and increasing expertise. I therefore also included below poster in the display.

A poster on the benefit of student science.