The first semester of academic year 2019/2020 I offered two air pollution courses, in which 33 groups of students collected air pollution data. The corona outbreak upended the academic calendar, so that this year’s air pollution course for year 4 Water Supply and Environmental Engineering students became scheduled from April 2021 instead of October 2020. This year’s batch was three sections, with a total of 101 students. One of the lessons of previous round was a lack of time. While a full research project requires due attention for all parts of the research cycle (from formulating research questions all the way to presenting findings), it is challenging to squeeze that into a single course. Therefore, for this year I decided to cooperate with my colleague (Bewketu Aweke), who would offer the course Research Methods to the same batch. From his course, he could cover research methodology, and from my course, I could cover air pollution. The students would conduct one research project that would be assessed for both courses.
Condensed course outline
An oncoming election upended a well-constructed schedule. In the first week of the course, we were informed that there would be six instead of the usual 12-15 weeks available. Students would be sent home after six weeks, and only come back a month later for conducting a final exam. We let the students execute a condensed form of the project, with the following outline:
- Week 1: topic and instrument introduction, start on proposals;
- Week 2: deadline of proposals.
- Weeks 3-4: data collection.
- Week 5: Data analysis.
- Week 6: Draft report. Based on feedback on the draft report, students could submit a final report some weeks later.
Simultaneous to the project activities across these weeks, there were the course lectures of the two courses. These lectures covered the theoretical course contents, but also provided input for the project activities. In total 21 groups of students conducted measurements of PM2.5, CO and/or CO2 at self-selected locations on or around campus.
Individual assignment
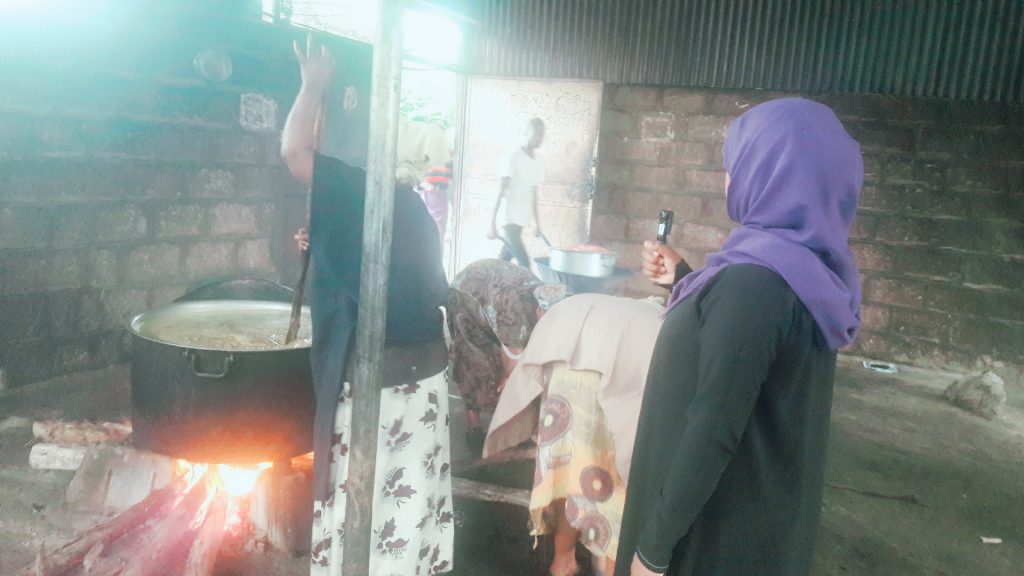
Apart from time limitation, a lesson of the earlier project was that with group work, it was difficult to let all students participate equally. This year, all students were sent to their hometown after six weeks. This provided a unique opportunity to let students individually apply what their group found during the measurements. Every student got the individual assignment to interpret their groups’ measurement for their hometown situation. This resulted in 101 students thinking about their family members or neighbors that might encounter situations in which they had conducted measurements. For example, a group member that measured during coffee preparation:
We measured an average concentration of 288 microgram/m3 PM2.5 during preparation of coffee ceremony at the campus coffee place. In my hometown we have coffee ceremony. My mom spends three hours of the day in coffee preparation. If my mom is exposed for three hours to a concentration of 288 μg/m3, her 24-hour average will be at least 3*288/24 = 36 μg/m3. Likely, it will be higher, because during the other 21 hours of the day she also cooks food for us. So, her average exposure is most likely higher than the standard of 25 μg/m3. I recommend to my mom to use electric stove.
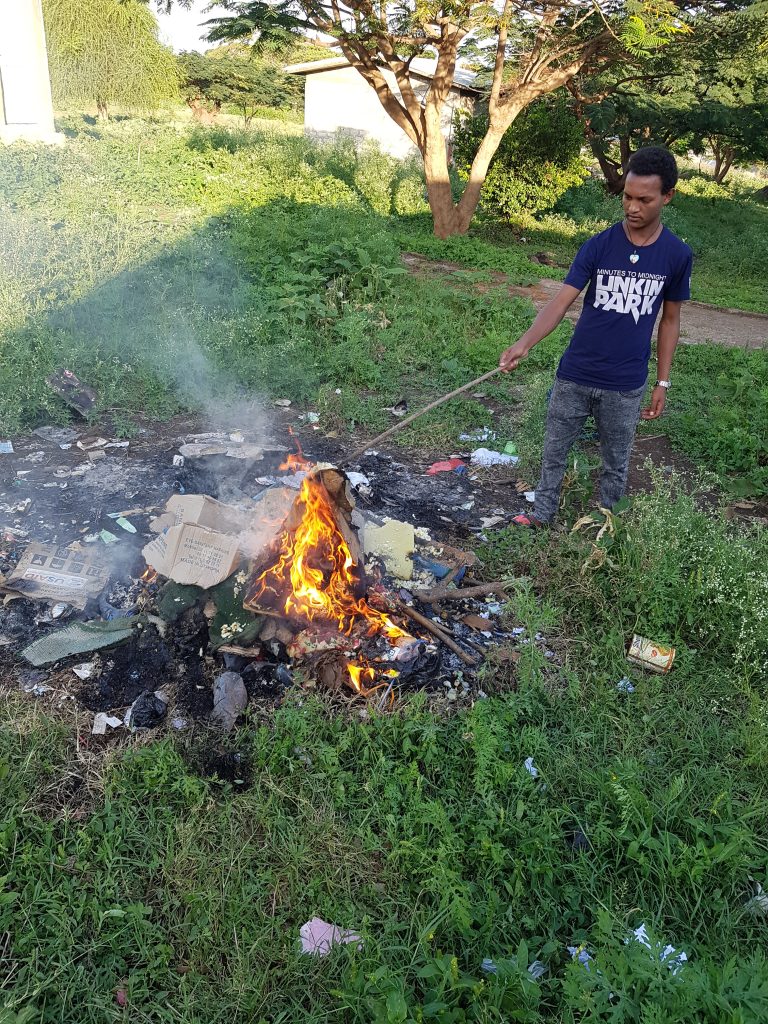
Or, a group member that conducted measurements close to waste burning:
We measured for 51 minutes while waste was burning. We measured an average concentration of 874 μg/m3. My sister works as a waste collector. She works probably for about two hours per day close to waste burning. If she is exposed for two hours to a concentration of 874 μg/m3, then her 24-hour average exposure will be at least 2*874/24 = 72.83 μg/m3. I recommend that the community reduces waste, and that instead of burning it, they use other waste disposal methods. My sister needs to be careful, wear a mask and stay far away from burning waste.