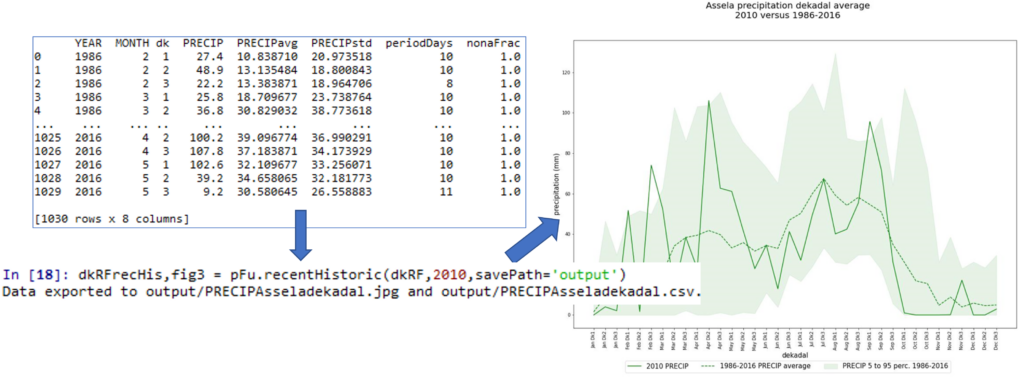
The Ethiopian Meteorology Institute (EMI) collects meteorological data from several weather stations all over Ethiopia. Data is processed manually in Microsoft Excel. To validate this data, or to produce tables or graphs, employees spend much time. Zerihun Bikila, employee of EMI and a master student in one of my Python classes, came up with the idea to create automated data processing tools with Python, under the name ‘PyCAMT’ (Python based Climate Data Processing and Visualization). Based on this, we worked on the development of a python package for meteorological data in Ethiopia.

For a month, I have enthusiastically coded together a preliminary package for importing, processing and visualizing EMI station data. Zerihun worked on a user interface in Jupyter Notebook. We tried to pitch the package to EMI management, but this so far proved difficult. Anyways, it was good practice for me to create a package in Python, and I am sure that I will use what I learned in the near future to help people automize and professionalize data processing and visualization.
I hosted the Python code as pycamtET on my GitHub repository. The Jupyter Notebook interface is hosted as pycamtETinterface. Below, you can see slides that introduce the package.

